
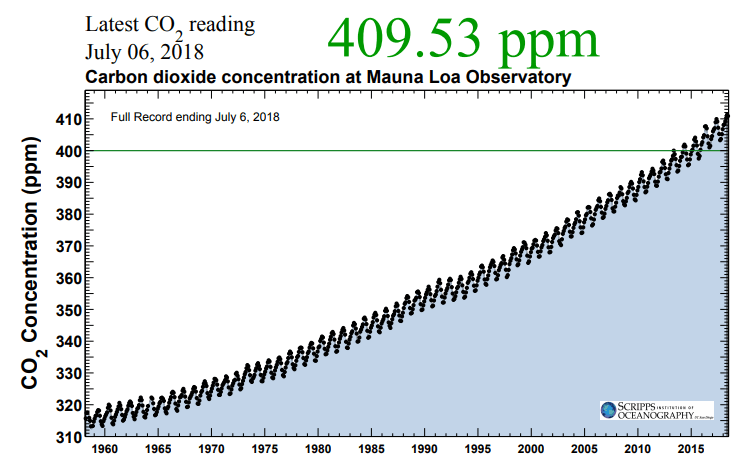
One of the main approaches for better understanding our future Uncertain World, both with respect to minimising that uncertainty but also identifying the limits to our knowledge, is to look to the past. A few years ago, we passed 400 ppm of CO2 in the atmosphere, a level that we have not experienced for about 3 million years, during the Pliocene epoch. That coincided with Bristol hosting the 2nd International Conference on the Pliocene, providing an opportunity through this piece, originally published on The Conversation, and its embedded video to discuss how we try to unravel ancient climates to better understand the future. I have updated some of the text, reflecting some of the changing intellectual landscape. To provide some immediate context, below is the latest record of current atmospheric carbon dioxide concentrations from the Mauna Loa Observatory (i.e. The Keeling Curve).
How can air bubbles trapped in ice for millions of years, or fossilised fern fronds, or the chemical make-up of rocks that were underwater in the distant past provide us with an inkling of our future?
The answer lies in these clues provided by studying the Pliocene epoch, the span of geological time that stretched from 5.3 to 2.6 million years ago. This period of Earth’s history is interesting for many reasons, but one of the most profound is that the Earth’s atmosphere apparently contained high concentrations of carbon dioxide. Our best estimates suggest concentrations of about 300-400 parts per million (ppm) – much higher than concentrations of 100 years ago, but the same or lower than today after centuries of industrialisation and fossil fuel burning.
So studying the Pliocene could provide valuable insight into the type of planet we are creating via global warming. Our researchers at the Cabot Institute recently released a video on the topic, which has coincided with pronounced flooding across the UK [in Winter and Spring 2014] and renewed attention focused on our weather and climate. There is little doubt that increased carbon dioxide concentrations will cause global warming. The key questions are how much, and with what consequences.
One of the key lessons from Earth history is climate sensitivity. Climate sensitivity can be expressed in various ways, but in its simplest sense it is a measure of how much warmer the Earth becomes for a given doubling of atmospheric carbon dioxide concentrations.
This is well known for the Pleistocene, and especially the past 800,000 years of Earth history, a period for which we have detailed temperature reconstructions and carbon dioxide records derived from bubbles of gas trapped in ancient ice cores.
During that time, across several ice ages, the planet’s climate sensitivity showed warming of about 2.5-3°C for a doubling of carbon dioxide, which falls in the middle of the range of predictions given by models. Ice core records, however, extend back no more than a million years, and this time period is generally characterised by colder climates than those of today.
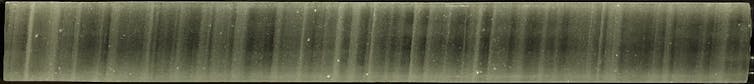
A section of an ice core of from 16,000 years ago. National Ice Core Laboratory
If we want to explore climate sensitivity on a warmer planet, we must look further back into Earth history, to times such as the Pliocene.
Reconstructing atmospheric carbon dioxide concentrations without relying on ice cores is admittedly more challenging. Instead of directly measuring the concentration of carbon dioxide in gas bubbles, we must rely on indirect records. For example, carbon dioxide concentration influences the number of stomata (pores) on plant leaves, and this can be measured on the fossils of ancient leaves. Alternatively, there are a number of geochemical tools based on how carbon dioxide affects the pH of seawater, or how algae take up carbon dioxide as they photosynthesise – these are recorded in the chemical composition of ancient fossils.
[For more info on how we reconstruct atmospheric carbon dioxide, especially in times pre-dating our ice core records, see this fantastic website maintained by Gavin Foster and friends.]
From p-CO2.org.
These means of drawing estimates come with larger margins of error, but they still provide key insights into climate sensitivity on a warmer Earth. Recent research indicates that these various carbon dioxide estimates of Pliocene carbon dioxide levels are converging, giving added confidence from which to derive estimates of climate sensitivity. In particular, it seems an increase of carbon dioxide from about 280ppm (equivalent to that before the industrial revolution) to about 400ppm in the Pliocene resulted in an Earth warmer by 2°C. The below figure shows the sea surface temperatures reconstructed for the Pliocene using a range of chemical and biological proxy data (a) and the difference (anomaly) between those temperatures and those of the modern pre-industrial world, i.e. before we started adding carbon dioxide to the atmosphere in significant quantities (b); notice how much hotter the oceans were, especially at high latitudes. From the Proceedings of the Royal Society.

This next figure is derived from an ensemble of climate models, which allows an extrapolation between data and therefore a comparison of temperatures on land and the modern pre-industrial world. Again, note how much higher temperatures were at high latitudes… but also continental interiors. We are seeing a manifestation of this now, with elevated temperatures occurring all over the globe but some areas experiencing much more dramatic warming. This work is from the amazing PlioMIP project and this figure is specifically from the PAGES website, adapted from Haywood et al., 2013.
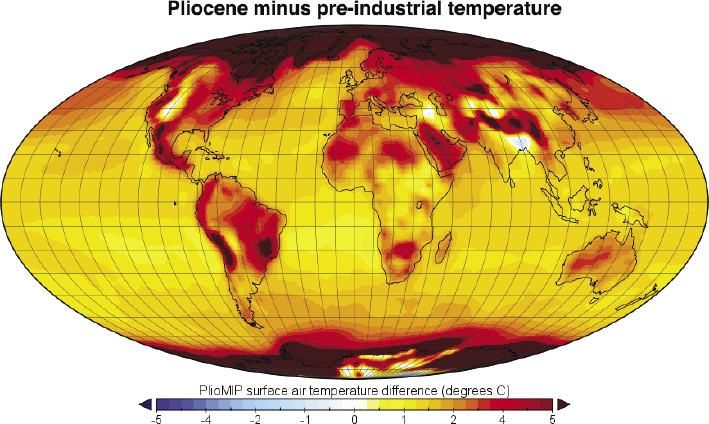
Taking into account other factors, this suggests a climate sensitivity of about 3°C, which confirms both the Pleistocene and model-based estimates. It also suggests that we have yet to experience the full consequences of the greenhouse gases already added to the atmosphere, let alone those we are still putting into it. [And finally, it suggests that there is a risk that we have already surpassed the agreed limits of the Paris Climate Agreement.]
So then, what was this much warmer world like? First of all, it was not an inhospitable planet – plants and animals thrived. This should not be a surprise – in fact, the Earth was much warmer even further back into the past. The changes in the climate we are inducing is a problem for us humans, and for our societies, not the planet we’re on. [And that is particularly evident, as I re-post this blog. We are experiencing a global heatwave that is causing forest fires (where associated with aridity), but it is also impacting infrastructure and the economy, warping rail lines, disrupting work patterns, driving up electricity usage. It is also causing deaths which raises a particularly acute and challenging question – are we and the ecosystems on which we depend prepared for the speed of this rapid global warming? Organisms and ecosystems had millions of years to evolve in a manner that allowed them to thrive in the Pliocene and previous greenhouse climates.]
Second, the Pliocene was a rather different world. For example, higher global temperatures were associated with a climate that was also wetter than at present. That provides important corroborating evidence for models that predict a warmer and wetter future.
Perhaps most striking, sea level in the Pliocene appears to have been between 10 to 40 metres higher than today, indicating that both the Greenland Ice Sheet and Antarctic Ice Sheet were markedly smaller. To put that into context, the Met Office has already commented on how flooding in the UK has been affected by sea level rise of 12cm over the last 100 years, and will be exacerbated further by another 5-7cm by 2030.
We must be careful in how we extract climate lessons from the geological record, and that is particularly true when we consider ice sheet behaviour. One widely discussed concept is ice sheet hysteresis. This is a fancy way of saying that due to feedback mechanisms, it could be easier to build an ice sheet on Greenland or Antarctica than it is to melt one. If hysteresis is a force stabilising our current ice sheets, then it may be that a planet with today’s carbon dioxide levels of 400 ppm will not necessarily have a sea level 20 metres higher than that of today – as it was during the Pliocene. On the other hand if hysteresis is rather weak, then the question is not whether we will see such a massive sea level change, but how long it will take to arrive (probably hundreds or even thousands of years).
Most importantly, the collective research into Earth history, including the Pliocene, reveals that Earth’s climate can and has changed. It also reveals that climate does not just change randomly: it changes when forced in ways that are relatively well understood – one of these is the concentration of carbon dioxide in our atmosphere. And consequently, there is little doubt from Earth’s history that transforming fossil carbon underground into carbon dioxide in the air – as we are doing today – will significantly affect the climate we experience for the forseeable future.
[Gerald Haug delivered the keynote for the Pliocene Conference and his outstanding public lecture is available here. With an introduction from the founder of the Organic Geochemistry Unit, Geoff Eglinton.]
[For a more fulsome discussion of how Warm Climates of the Past can hold Lessons for the Future, please check out our Special Royal Society Volume on the topic. Led by my Bristol colleague Dan Lunt but with lots of friends.]
1 thought on “The Pliocene – The last time Earth had 400 ppm of Carbon Dioxide”